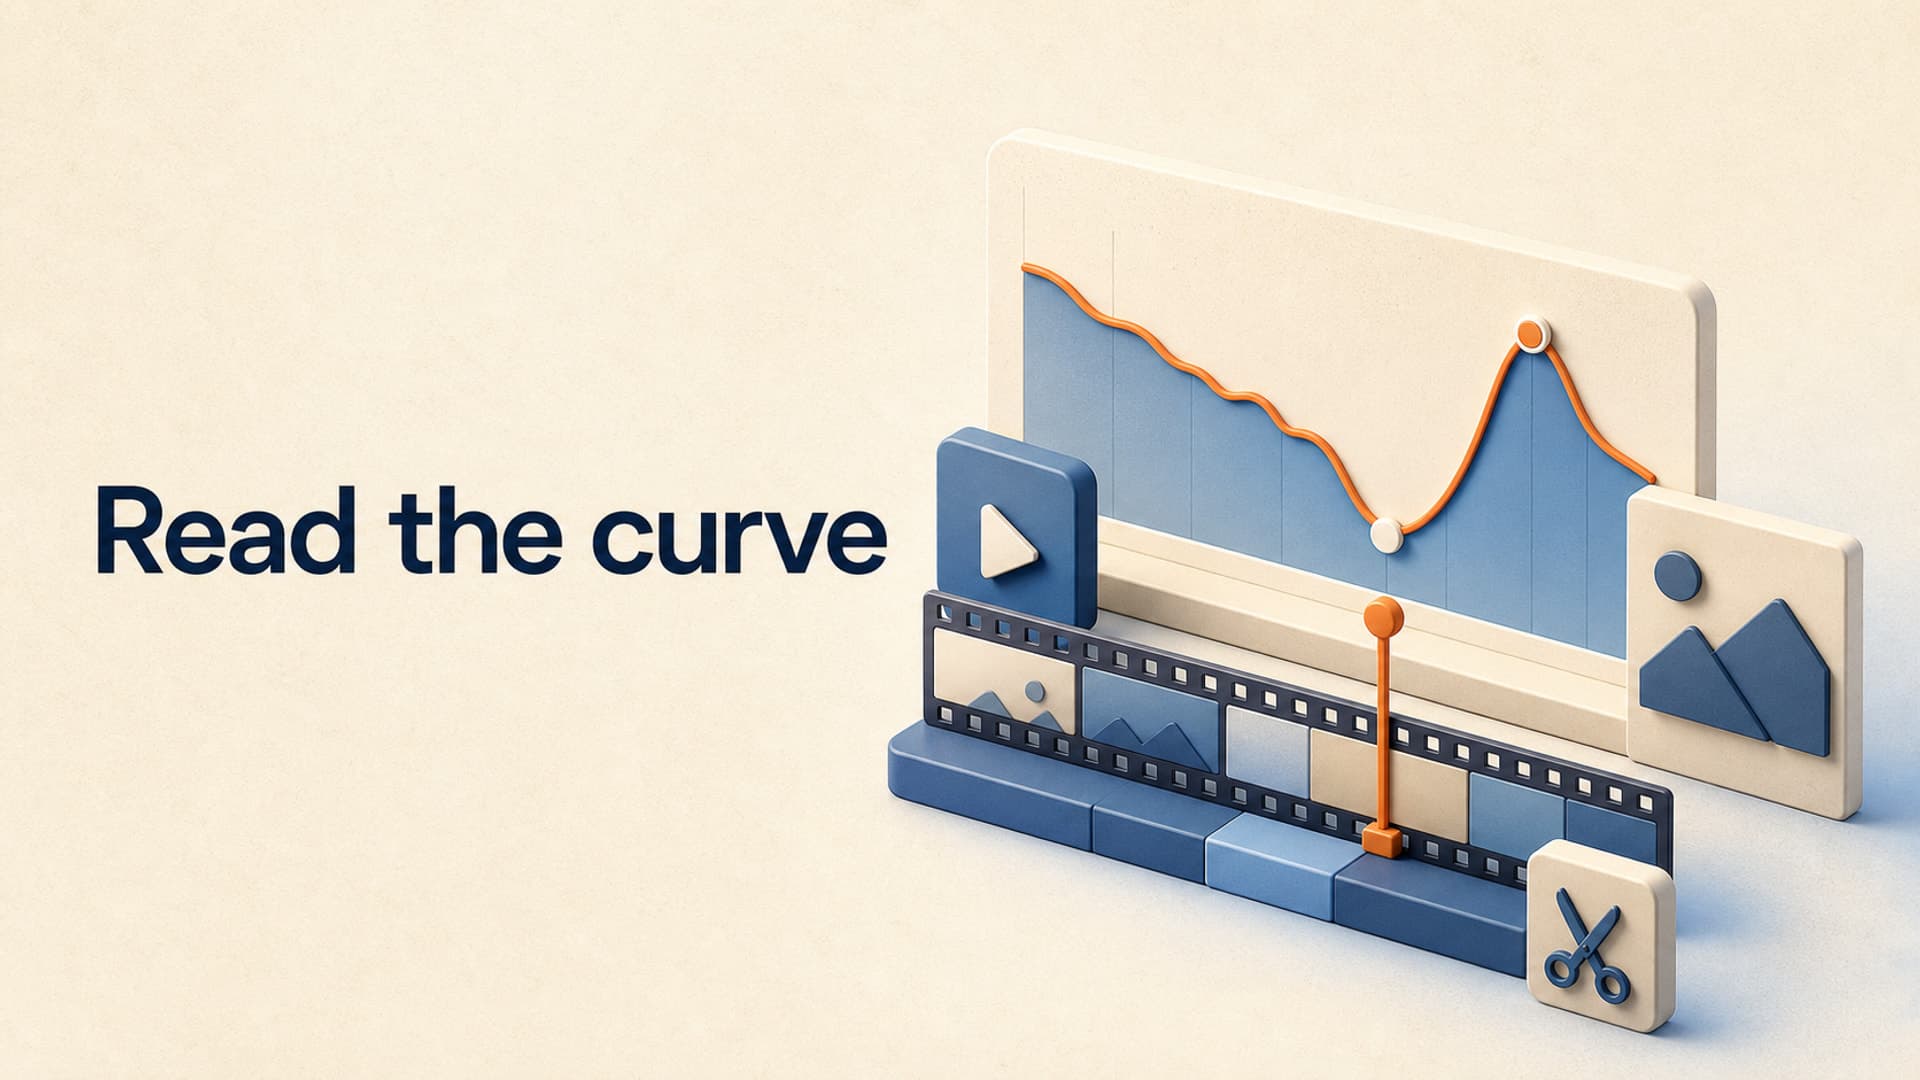
A retention graph can make a creator irrational.
One dip becomes proof that the topic failed. One spike becomes a command to repeat the same trick forever. A lower percentage at the end of a 90-minute video gets compared with a 12-minute upload as if the two asked the same thing of the viewer.
That is scorecard thinking: reduce the curve to good or bad, then react emotionally.
Editors need a different question: what production decision created this shape, and what is the smallest change that could test that explanation?
YouTube's audience retention report can highlight intros, top moments, spikes, and dips. It can also compare a video with other uploads of similar length. Those are useful clues, but the graph does not diagnose your script for you. A dip can mean boredom, confusion, a resolved promise, an awkward transition, or simply that a chapter attracted a different kind of viewer.
The job is to connect the curve back to the actual minute of the video.
Start With the Right Comparison
Do not begin with a universal benchmark. YouTube says there is no single optimal video length, and its typical-retention comparison uses your recent videos of similar length.
That matters for long-form faceless channels. A 75-minute sleep-history episode, a 22-minute explainer, and a 40-minute documentary can all be healthy products with very different curves. Percentage viewed alone makes the longest format look weak even when it produces more average watch time.
Use three comparisons in this order:
- The video's own promise. Did viewers stay through the section that delivered what the title and thumbnail promised?
- Similar-length uploads. How does the curve compare with recent videos that asked for a comparable time commitment?
- A matched format group. Compare documentaries with documentaries, narrated sleep stories with narrated sleep stories, and explainers with explainers.
YouTube's Advanced Mode supports comparisons between videos and groups. Starting in July 2026, YouTube is gradually rolling out an updated Studio experience, so the exact navigation may differ, but the principle is stable: compare like with like before declaring a problem.
Also wait for the data. YouTube notes that retention processing usually takes 1-2 days, and highlighted moments require a video of at least 60 seconds with at least 100 views. An early graph with thin traffic is a clue, not a production mandate.
Label the Shape Before You Explain It
Open the video beside the retention graph and record the timestamp of every meaningful change. Do not write the cause yet. First label only what the curve did.
| Curve shape | Neutral observation | Questions to ask |
|---|---|---|
| Sharp early fall | Many viewers left near the opening | Did the intro match the title and thumbnail? |
| Sudden dip | Viewers skipped or stopped at one point | What changed in the script, audio, or visual treatment? |
| Spike | More viewing or rewatching occurred here | Was the moment valuable, or was it unclear? |
| Flat section | The remaining audience stayed unusually steady | What promise, rhythm, or information density held attention? |
| Slow continuous decline | Interest faded without one obvious break | Did the section repeat a pattern or delay the next payoff? |
This neutral pass prevents hindsight from inventing a neat story. If you start with “the AI voice sounded bad,” every wobble will look like voice evidence. If you start with “the curve fell 6 percentage points between 14:35 and 14:55,” you can inspect what actually happened.
For each marked timestamp, watch 30 seconds before and after it. Read the matching script lines. Note the narration, visual change, music change, chapter transition, and whether the viewer's current question was answered.
Use Five Failure Buckets
Most useful retention findings fit one of five buckets. The bucket determines what you change next.
1. Packaging failure
The video opens on a different experience from the one promised by the title and thumbnail.
A title about why a city vanished opens with two minutes of general geography. A documentary promising a disputed discovery begins with the channel logo, a greeting, and a definition. The content may be accurate, but the viewer has not received reassurance that the promised video has started.
YouTube defines intro performance around the first 30 seconds and recommends checking whether the opening matches the thumbnail and title. For the next upload, test a direct promise-confirming scene before background context.
2. Structure failure
The script resolves its main question too early, repeats a completed point, or starts a chapter with no new tension.
This often appears as a decline immediately after a payoff. The problem is not that the payoff was too good. The script failed to open the next question before closing the current one.
The edit is structural: add a bridge that explains why the answer creates a deeper problem. Do not merely add faster visuals to a section whose narrative job has ended.
3. Clarity failure
A spike is not automatically a victory. YouTube notes that spikes can represent rewatching or sharing, but viewers may also replay a confusing explanation.
Check comments and the exact script. If a map appears for four seconds while the narration introduces three unfamiliar place names, rewatching may be repair work. The next version needs fewer terms, a longer visual hold, or one sentence that states the relationship plainly.
4. Pacing failure
The idea is valid, but the delivery spends too long at one information level.
Common signs include a gradual decline during a list of similar examples, repeated stock-footage rhythms, or narration that gives every sentence the same emphasis. The fix might be cutting the third example, varying sentence length, or moving from illustration to consequence sooner.
Pacing is not synonymous with more cuts. A new image every three seconds can feel slower when none changes the viewer's understanding.
5. Audience-fit failure
Different viewer groups can react differently to the same passage. YouTube lets eligible reports compare segments such as new versus returning viewers and subscribers versus non-subscribers.
If new viewers leave during a reference regular viewers understand, the format may need one line of context. If returning viewers leave during a repeated explanation, the series may be over-explaining its own premise.
Do not average away that distinction. Decide which audience the video was meant to serve, then judge the section against that job.
Build a Retention Revision Log
A graph becomes useful only when it changes a future production decision. Keep a compact log with one row per finding:
| Timestamp | Observation | Evidence in the video | Likely bucket | Next-video change | Success check |
|---|---|---|---|---|---|
| 0:00-0:24 | Faster fall than typical intro | Logo and premise setup delay the central question | Packaging | Open on the disputed claim; move identity sting after the hook | Better first-30-second retention versus matched episodes |
| 14:38-14:57 | Sharp dip | Chapter recap repeats the previous conclusion | Structure | Replace recap with the next unresolved question | No equivalent chapter-transition dip |
| 31:10-31:35 | Spike | Dense map introduces four locations | Clarity | Split the map into two beats and define the route first | Fewer confusion comments without losing the top moment |
| 42:00-48:00 | Steady decline | Six examples share the same narration and visual rhythm | Pacing | Keep the strongest three and alternate example with consequence | Flatter curve across the comparable list section |
Limit the next upload to one or two major changes. If you rewrite the opening, shorten every chapter, change the voice, double the visual turnover, and choose a different topic, the result cannot teach you which decision mattered.
Treat the log as an experiment queue. Rank findings by three factors:
- Magnitude: how large and repeatable is the curve change?
- Confidence: how clearly does the video evidence support the explanation?
- Reach: will the fix affect one minute or the channel's recurring format?
A modest intro problem that appears across five uploads deserves attention before one dramatic dip caused by an unusual sponsor message or source quotation.
A Worked 14:40 Dip
Imagine a 52-minute faceless documentary about an abandoned railway.
At 14:40, retention drops sharply. The editor watches the surrounding minute and finds this sequence:
- At 14:28, the narration answers the opening question: the railway failed because its freight estimate depended on a mine that never reached capacity.
- At 14:36, the music resolves.
- At 14:40, a chapter card appears.
- At 14:44, the narrator begins a two-minute biography of the chief engineer.
- At 16:50, the biography finally reveals that he concealed the mine's production reports.
Calling this “viewers dislike biographies” would be premature. Three events overlap: the main promise feels complete, the audio signals an ending, and the new chapter withholds its relevance.
The smallest useful test is not deleting every biography. It is changing the bridge:
The railway was doomed by a mine that never delivered. But the stranger question is why investors kept funding it after the numbers were known.
Then introduce the engineer as the person who controlled those numbers. The facts remain; their narrative job becomes visible immediately.
For the next matched documentary, record retention across the equivalent promise-to-new-question transition. If the dip softens, keep the bridge rule. If it does not, investigate the biography's density or visual treatment next.
Turn the Finding Into the Next Production
Retention analysis happens in YouTube Studio. The production challenge is making sure the lesson survives into the next script and video.
AutoTube.pro is one practical option for applying those lessons without rebuilding the entire workflow. Its step-by-step mode lets a creator revise the script before generating narration, then inspect the result again before visuals and rendering. That makes a specific retention experiment - such as replacing recap-heavy chapter openings with unresolved questions - easier to enforce at the right stage.
Reusable channel presets are also useful when testing one variable. Keeping the established voice and visual style consistent while changing the opening structure makes the comparison more interpretable. If the experiment is about visual pacing instead, automatically timed visuals can provide the baseline while the creator focuses manual attention on the few sections identified in the revision log.
The platform does not read the retention graph or decide why viewers left. Editorial diagnosis remains the creator's job. The benefit is having a repeatable production environment where one evidence-backed change can be carried into the next long-form upload.
Make One Revision You Can Measure
Open one recent video with enough data. Mark the three largest curve changes, watch the surrounding minute, and place each one in a failure bucket.
Then choose one recurring issue - not the most emotionally painful one - and write a next-video rule specific enough to verify. “Improve retention” is not a rule. “State the next unresolved question before every chapter card” is.
After the next comparable upload has processed enough data, return to the same timestamp type and compare the result. That loop is how a graph stops judging your old video and starts editing your next one.
If you want a consistent place to apply those script and pacing experiments across long-form production, explore AutoTube.pro.